Anonymous E-Commerce Brand
E-commerce
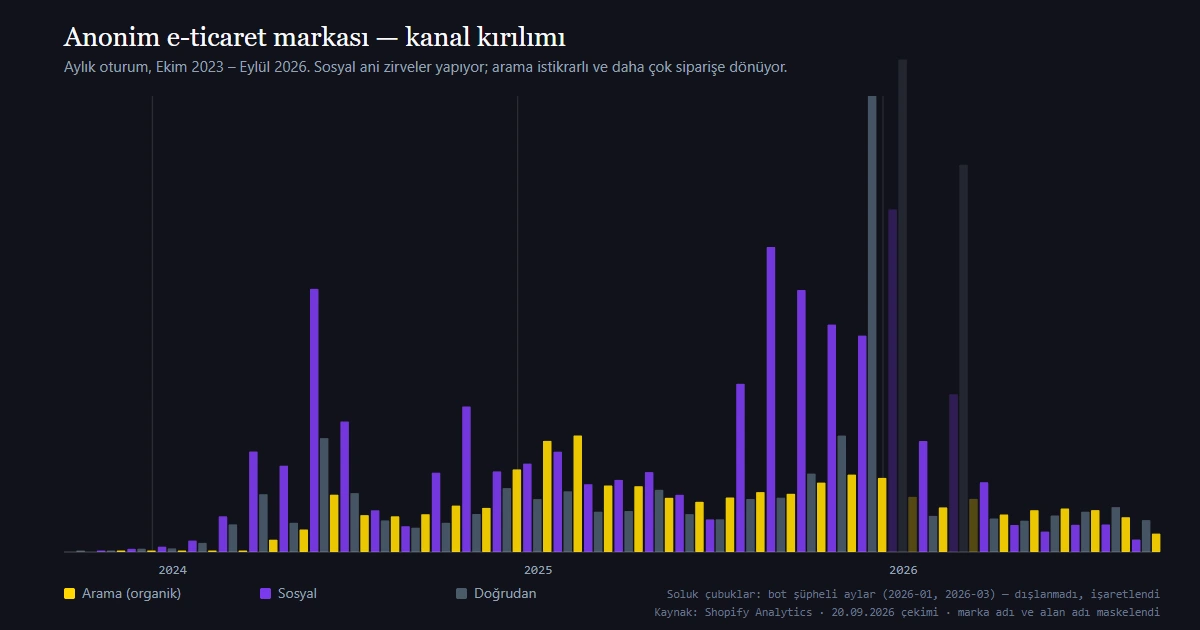
Thirty-four months of commerce data and sixteen of search data. Social brought large but volatile traffic, while organic search turned fewer sessions into more orders — 984 orders, a third of attributed revenue and 97,900 Google clicks came from search. And it ranked on generic category queries rather than on the brand name: five of the top ten queries carry no brand term. Against that, conversion rate, customer return rate and the share of pages indexed all stayed weak; all three are stated below.
Brand name, domain, client name and sensitive values are masked because no permission was given; the meaning of the data is unchanged.
Scope
- Website and e-commerce foundation
- SEO
- Social media content production
Period
2023-12 — 2026-09
Measurement start: 2023-10
Measured results
- ORGANIC SEARCH CLICKS
- 97.900
- Search Console · 16 months (19 May 2025 – 18 Sep 2026) · 1.92M impressions, 5.1% CTR · 2025-05/2026-09
- AVERAGE GOOGLE POSITION
- 6,8
- Search Console · same period · weighted average across all queries · 2025-05/2026-09
- ORDERS FROM ORGANIC SEARCH
- 984
- Shopify Analytics · 34 months (Dec 2023 – Sep 2026) · channel attribution · 2023-12/2026-09
- SEARCH SHARE OF ATTRIBUTED REVENUE
- %33
- Shopify Analytics · same period · social 16%, direct/unattributed 50% · 2023-12/2026-09
- ORGANIC REVENUE PREMIUM
- +14,1 puan
- GA4 · last 28 days · organic search is 30.7% of sessions but 44.8% of revenue; paid social is the reverse (15.9% → 11.1%) · 2026-08/2026-09
- AI ASSISTANT SESSIONS
- 355
- GA4 · last 28 days · 58.6% engagement (twice that of direct traffic) · ₺0 attributed revenue · 2026-08/2026-09
- INDEXED PAGES — WEAK POINT
- %2,3
- Search Console · 4,978 indexed, 211,806 not indexed · crawl budget problem · 2026-09
- CONVERSION RATE — WEAK POINT
- %0,1–0,9
- Shopify Analytics · monthly range · below e-commerce expectation, not closed · 2023-12/2026-09
Deliverables and technical improvements
- ✦Shopify store setup and product foundation
- ✦Thirty-four months of continuous social content production
- ✦SEO work that turned organic search into a stable sales channel
- ✦Ranking on generic non-brand product queries: 5 of the top 10 queries are non-brand and bring 11,296 clicks
- ✦Channel-level attribution measurement (Shopify Analytics)
- ✦Product snippet and merchant listing structured data: 502 + 984 valid, 0 invalid
What stayed open
- The returning-customer rate stayed between 1% and 10%; 2,928 of 3,077 orders came from new customers. Retention was not solved in this engagement.
- Average order value rose from ₺710 to ₺5,482, but that is a lira figure with no inflation adjustment; calling it “7.7x growth” would mislead.
- The session spikes in January and March 2026 (358k and 108k) are most likely bot traffic — conversion falls to 0.02% in those months. They are not deleted from the chart, only faded.
- Paid media is not part of this case: Meta spend data could not be pulled yet, and Shopify’s attribution model does not measure the same thing as Meta’s.
- 97.7% of pages are not in Google’s index (4,978 against 211,806). Shopify’s variant and filter URLs consume the crawl budget; this was not solved and remains the largest technical obstacle to organic growth.
- A single product page carries about 32% of organic clicks (31,719 of 97,900). The channel is healthy but concentrated; if that page loses rank the total drops sharply.
- The 355 sessions from AI assistants produced ₺0 attributed revenue in 28 days. The traffic is real and engaged (58.6%) but does not convert; claiming “AI brings sales” is not supported by this data.
Source
Three independent sources, all pulled 20 Sep 2026: Shopify Analytics (ShopifyQL, 37 months), Google Search Console (domain property, 16 months) and GA4 (last 28 days). The “search sells more” finding appears independently in both Shopify and GA4.
Let’s talk about a similar project.
All workLet's Review Your Project Together.
Fill in the form and we will audit your digital setup and growth potential, free of charge.