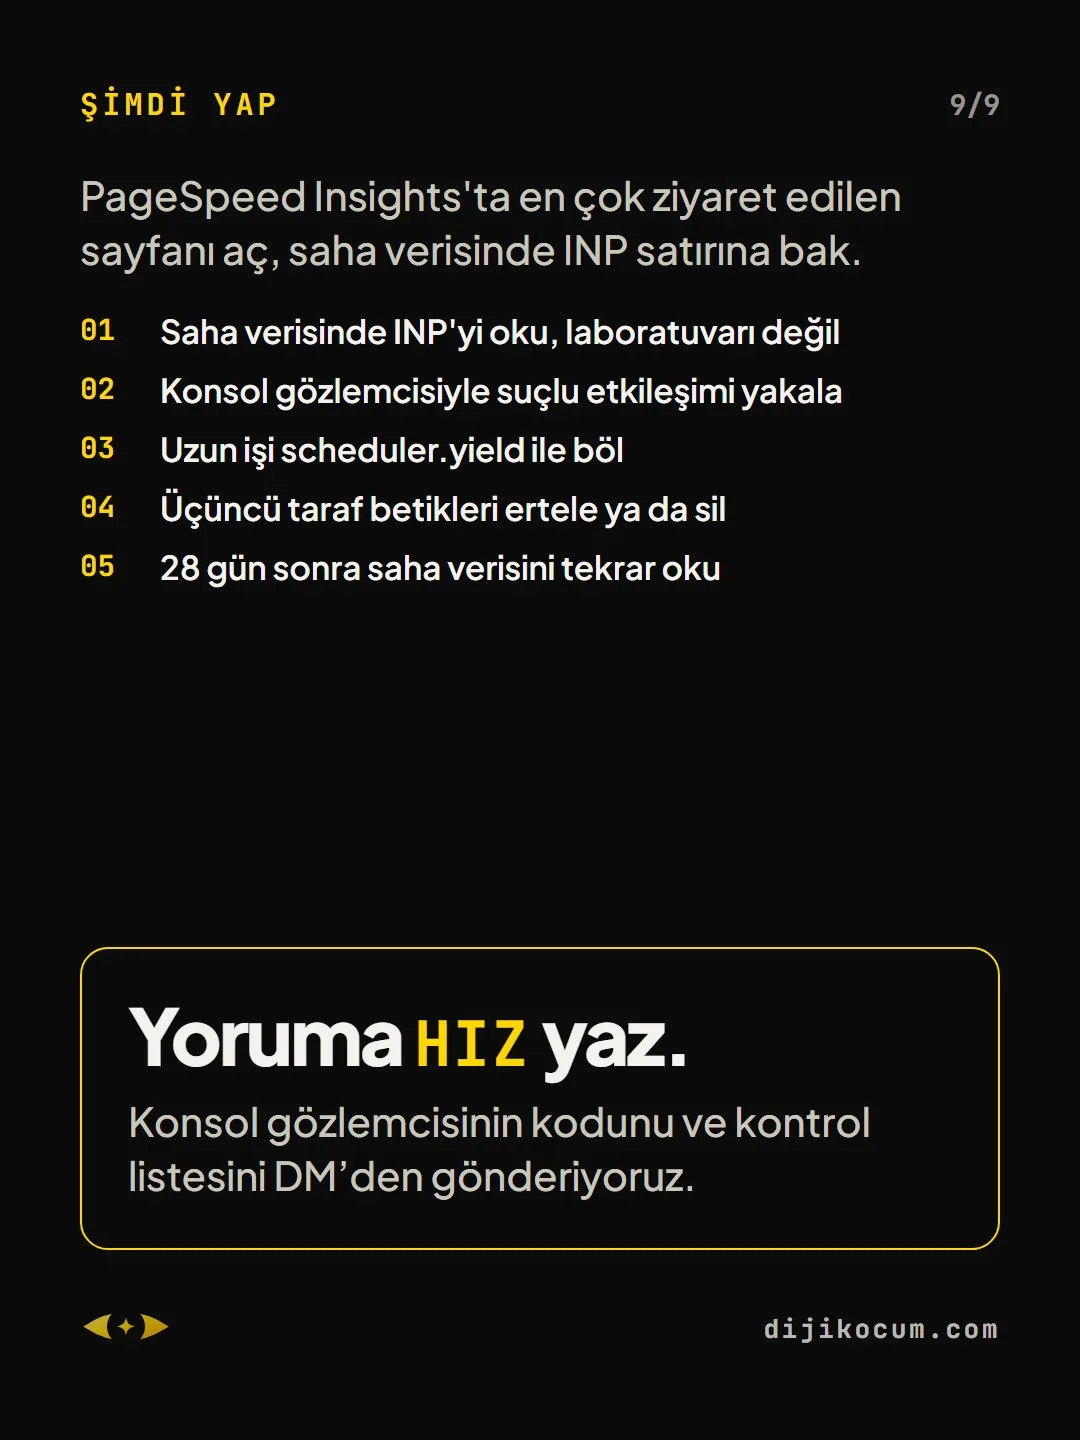
Visuals in Turkish · the full text is on this page
How-To Guide · Web
Your Site Is Fast. Until Someone Clicks: How to Fix INP
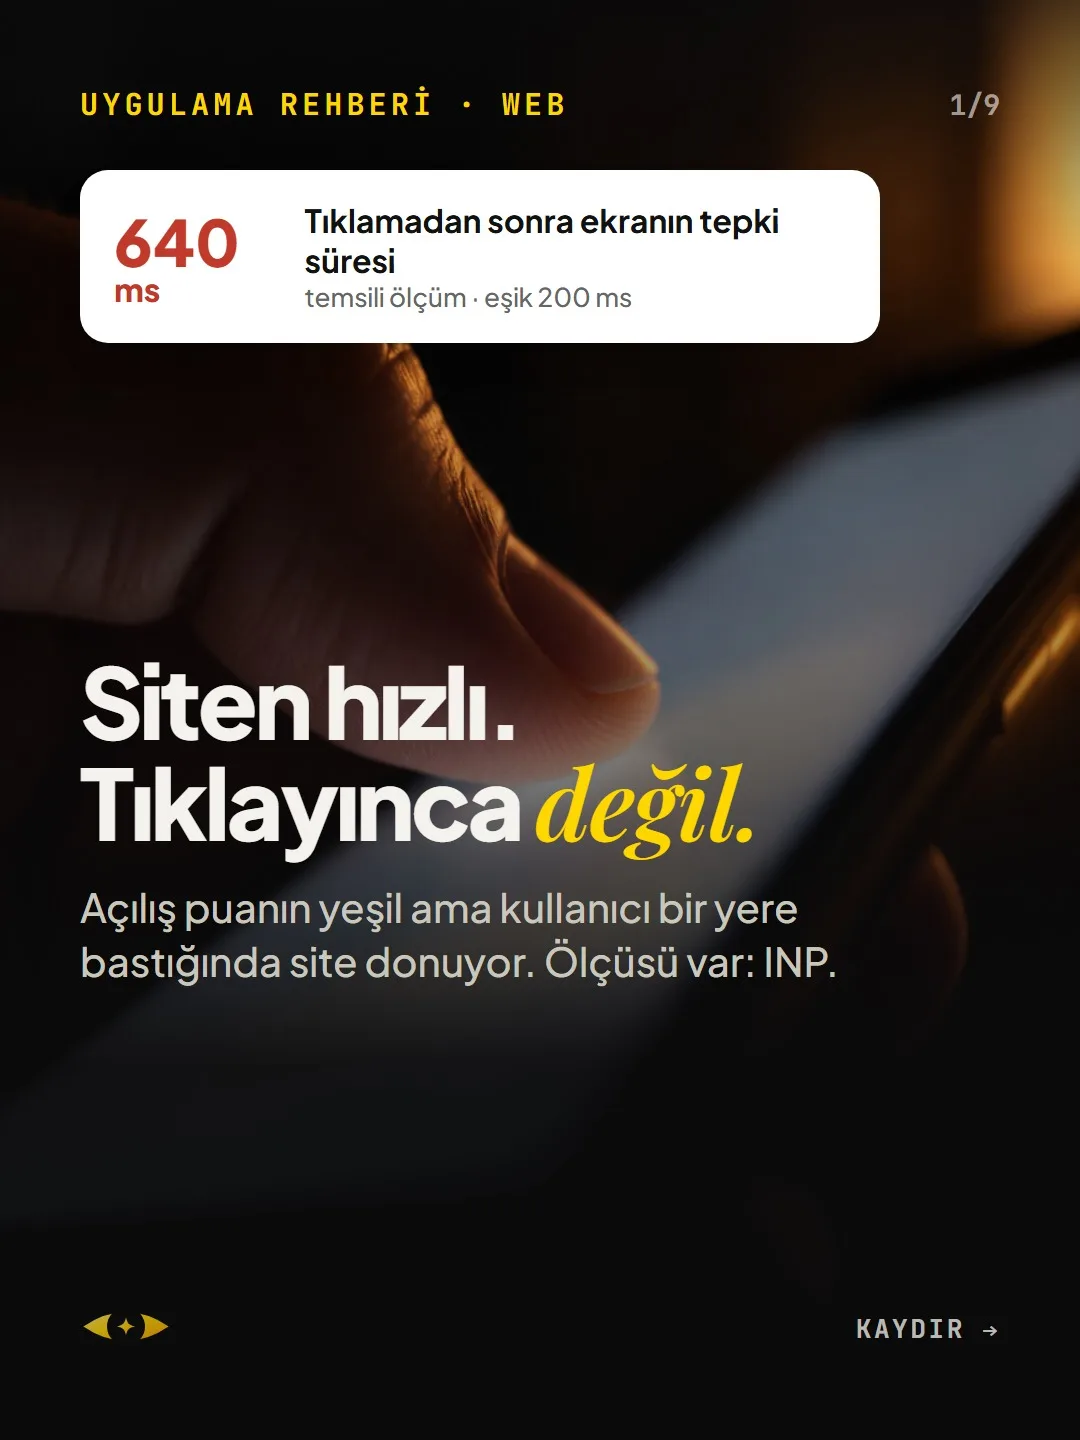
Your load score is green, but the site freezes when a user taps something. There's a metric for it: INP.
Short answer
INP (Interaction to Next Paint) measures how long it takes, after a user clicks, for a visible change to appear on screen, and it replaced FID as a Core Web Vital in March 2024. The good threshold is 200 milliseconds; above 500 ms is poor. A site with a green load score can still freeze on click; the fix is to break up long JavaScript tasks and defer third-party scripts.
5 steps · 2 min read · · Turan Yasin Salcı
Step by step · 5 steps
0/5 checked · saved in this browser only
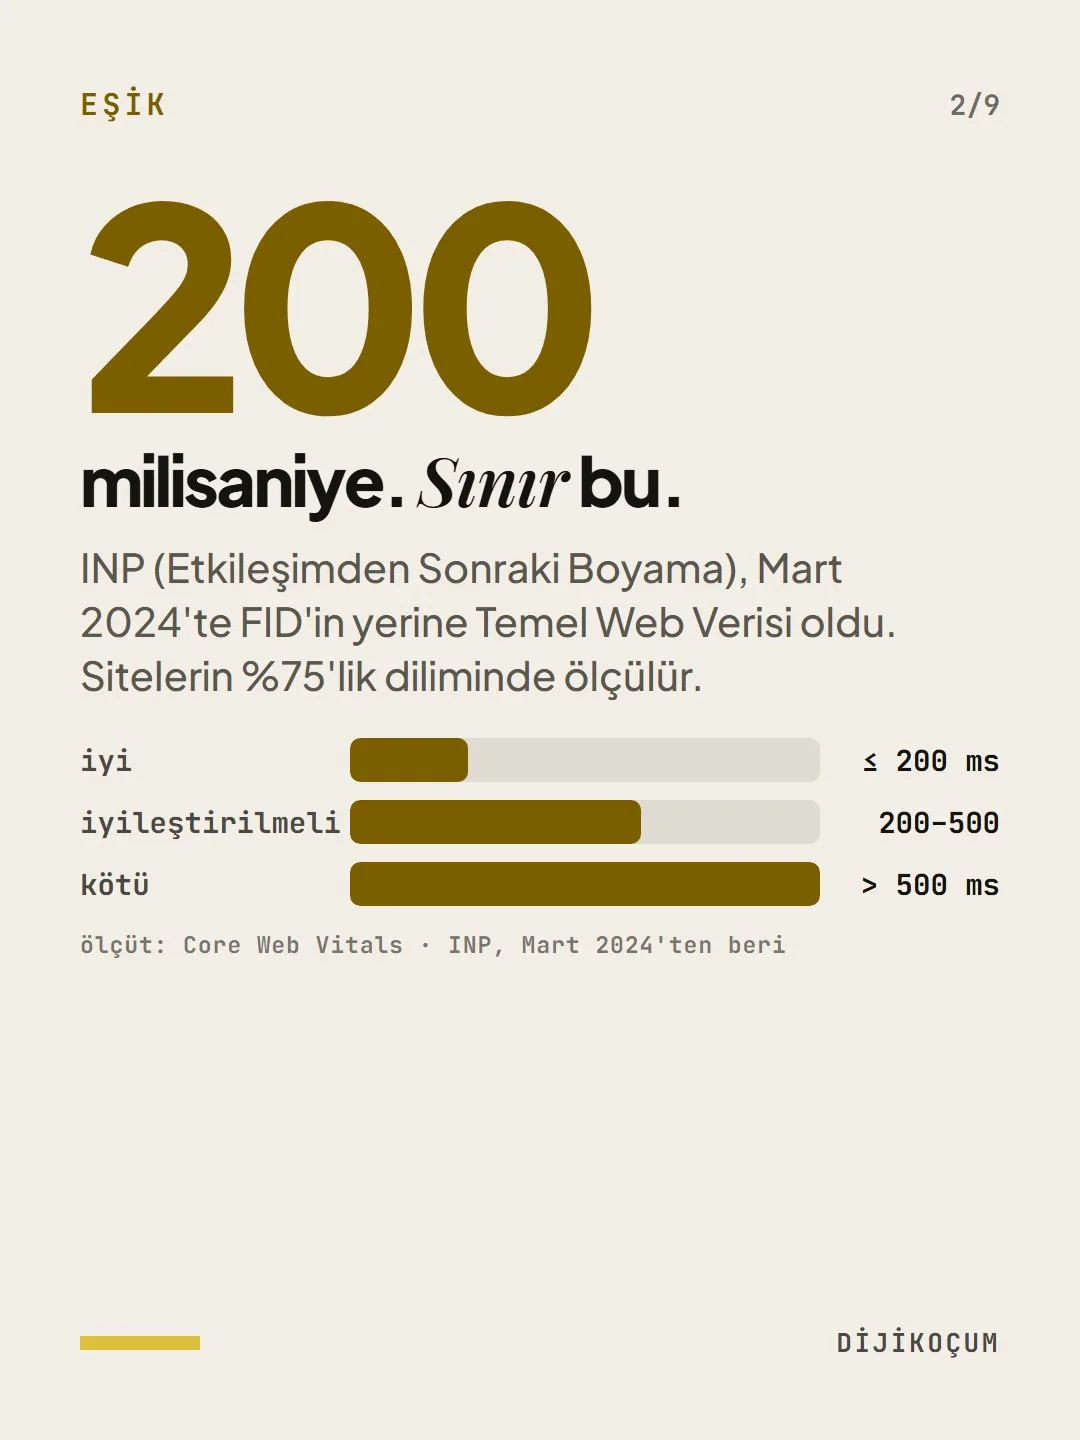
200 milliseconds. That's the limit.
INP (Interaction to Next Paint) replaced FID as a Core Web Vital in March 2024. It's measured at the 75th percentile of a site's visits.
- good: ≤ 200 ms
- needs improvement: 200–500
- poor: > 500 ms
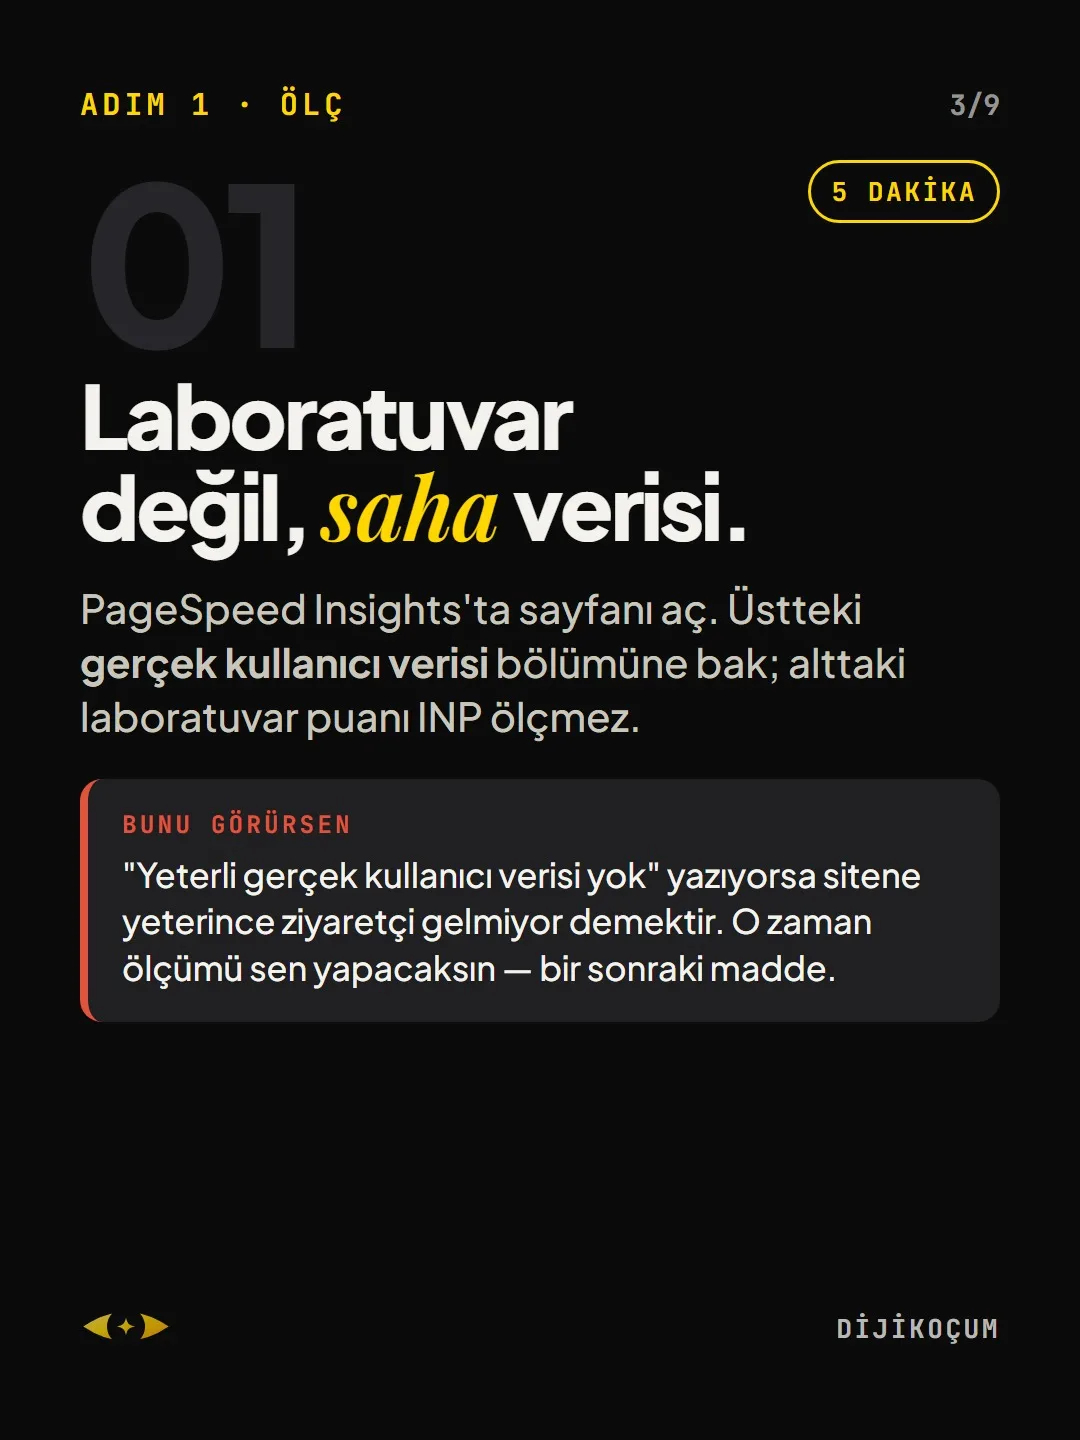
Field data, not lab data.
5 MINUTESOpen your page in PageSpeed Insights. Look at the real user data section at the top; the lab score below doesn't measure INP.
If you see this: If it says there isn't enough real-user data, your site isn't getting enough visitors. Then you'll do the measuring yourself — the next item.
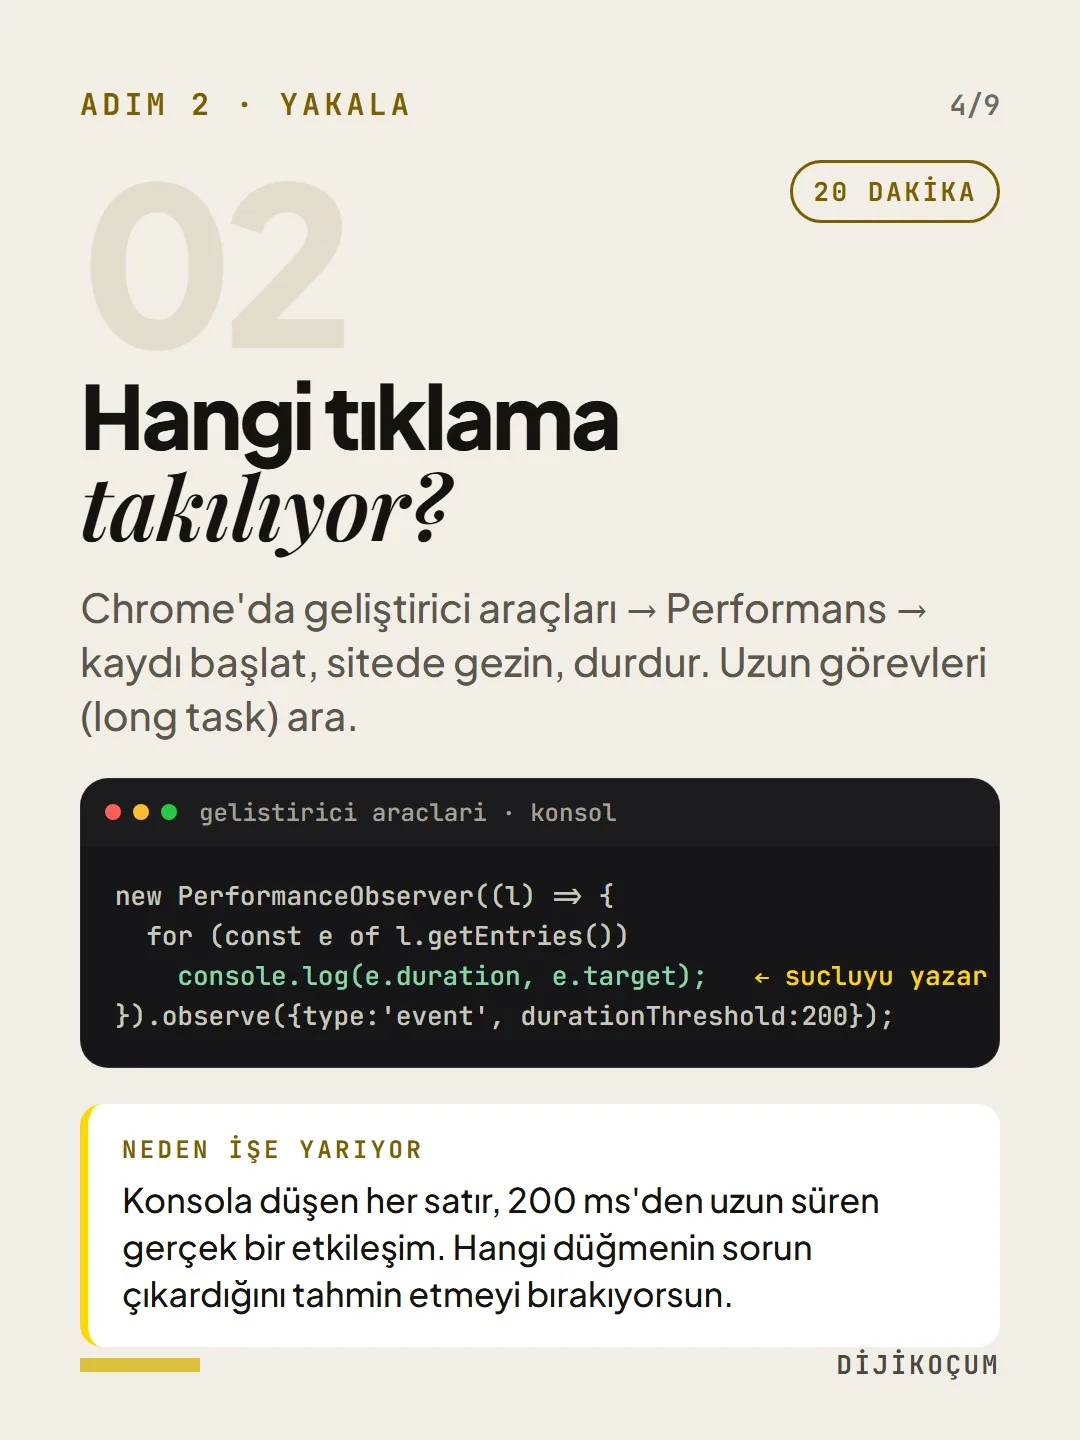
Which click is getting stuck?
20 MINUTESIn Chrome, open developer tools → Performance → start recording, browse the site, stop. Look for long tasks.
Why it works: Every line that lands in the console is a real interaction that took longer than 200 ms. You stop guessing which button is causing the problem.
new PerformanceObserver((l) => { for (const e of l.getEntries()) console.log(e.duration, e.target); }).observe({type:'event', durationThreshold:200});Break up the long task.
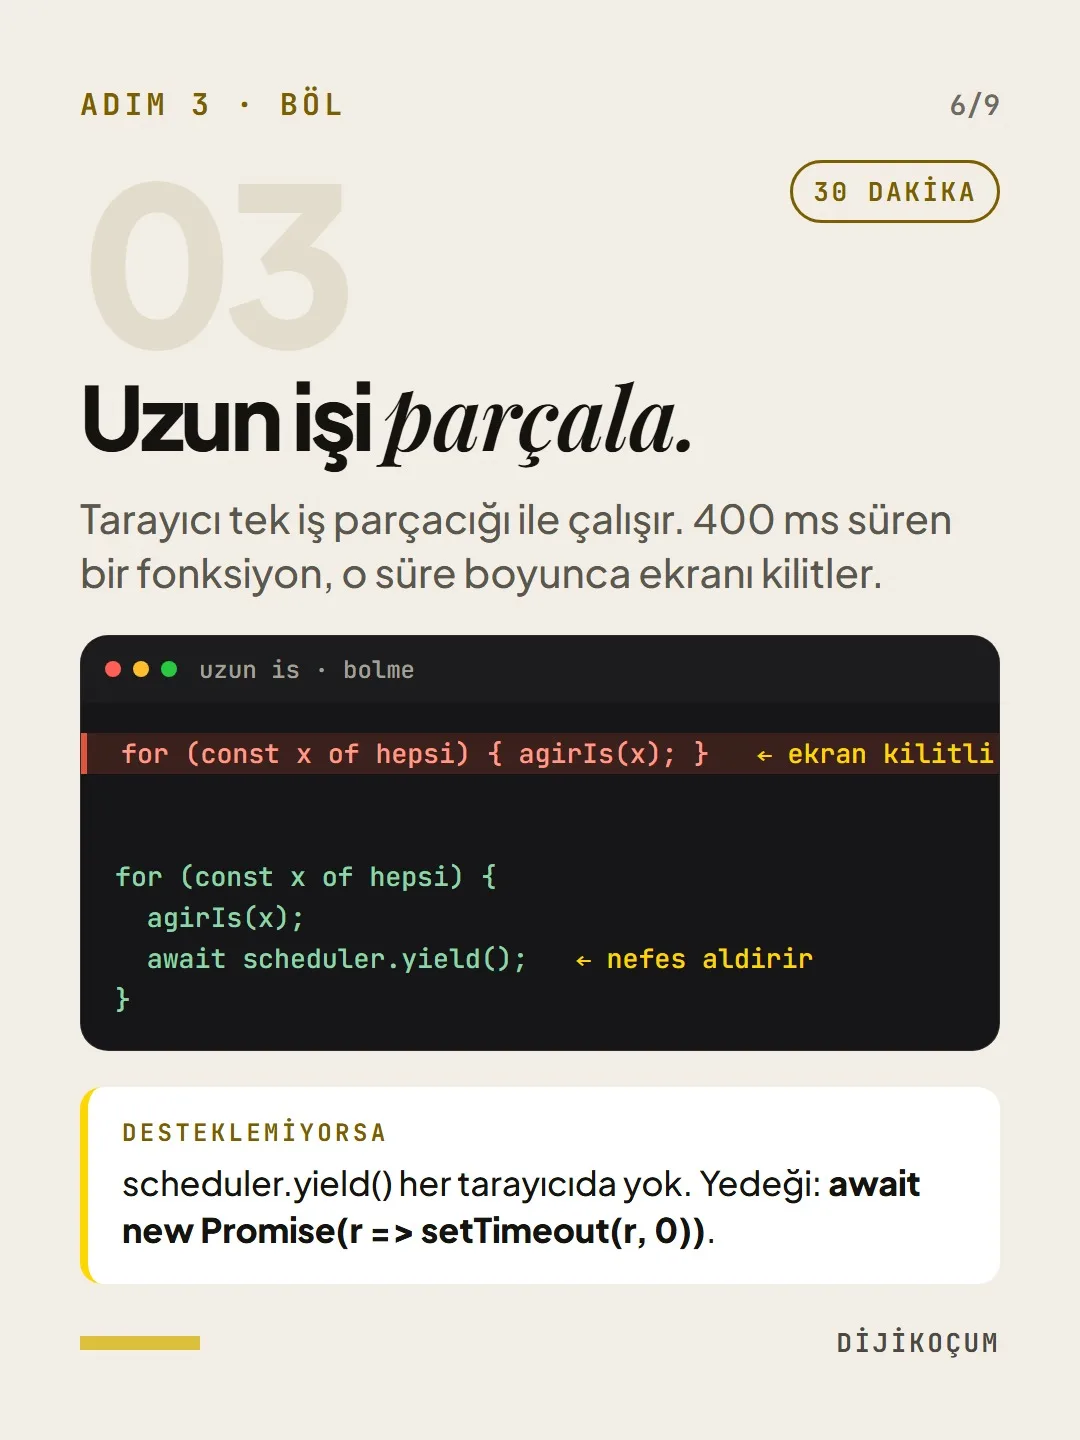
30 MINUTESThe browser runs on a single main thread. A function that takes 400 ms locks the screen for that whole time.
If it's not supported: scheduler.yield() isn't available in every browser. The fallback: await new Promise(r => setTimeout(r, 0)).
for (const x of items) { heavyWork(x); } for (const x of items) { heavyWork(x); await scheduler.yield(); }Third-party scripts.
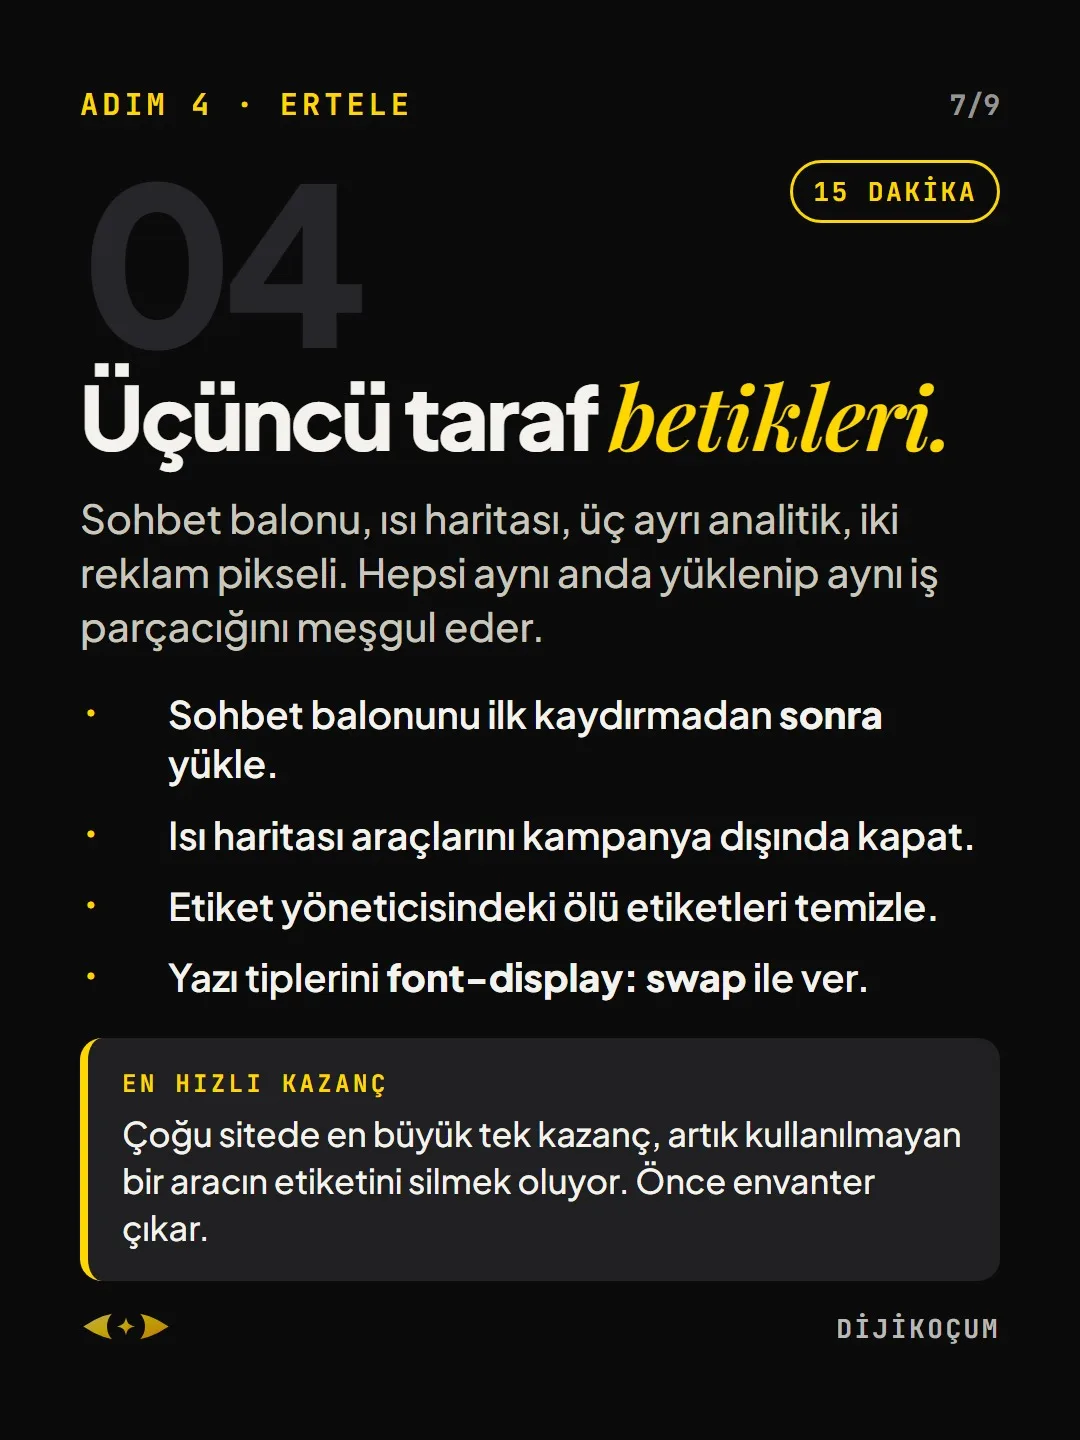
15 MINUTESA chat bubble, a heatmap, three separate analytics tools, two ad pixels. They all load at the same time and keep the same thread busy.
- Load the chat bubble after the first scroll.
- Turn off heatmap tools outside of campaigns.
- Clean up dead tags in your tag manager.
- Serve fonts with font-display: swap.
The fastest win: On most sites, the biggest single win is deleting the tag of a tool that's no longer used. Take inventory first.
How to measure it
How will you know it's fixed?
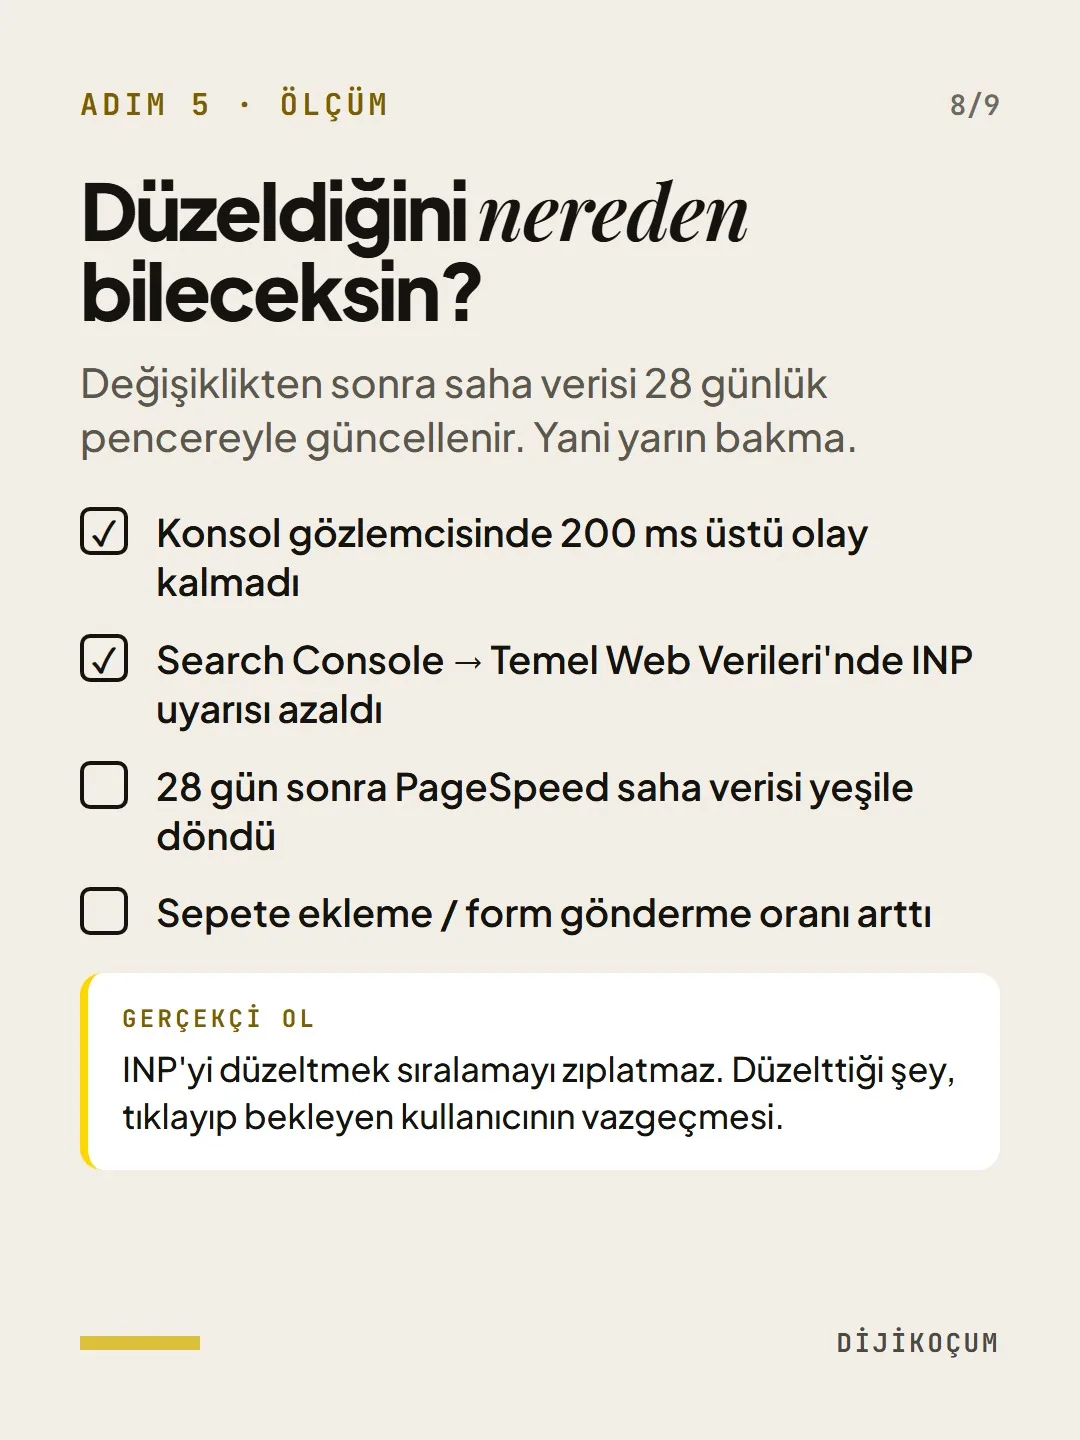
After a change, field data updates over a 28-day window. So don't check tomorrow.
- No events over 200 ms left in the console observer
- INP warnings in Search Console → Core Web Vitals went down
- After 28 days, the PageSpeed field data turned green
- Add-to-cart / form submission rate went up
Be realistic: Fixing INP won't make your rankings jump. What it fixes is the user who clicks, waits and gives up.
Free · PDF
Download the SPEED checklist.
A printable checklist version of the steps on this page. The PDF is in Turkish; no sign-up needed.
Download the checklist (PDF in Turkish)Sources
- Aweb.dev: Interaction to Next Paint (INP)Primary source · checked: September 20, 2026
[A] primary source · [B] industry research · [C] practitioner · [D] our own data
This post is also on (in Turkish)
Frequently asked questions
My PageSpeed score is green, but the site freezes when I click. Why?
The lab score measures how the page loads; it doesn't measure INP. The response after a click is shown by the INP line in the real-user (field) data at the top of PageSpeed Insights: under 200 ms counts as good, over 500 ms as poor.
When will I see the result after fixing INP?
Field data updates over a 28-day window; checking the next day won't show anything. After the fix, you need to watch the same page's INP value for a few weeks.
Next step
Let’s look at your site together.
Free Digital Checkup: a health score for your website, your ads and your visibility in AI search, plus what to fix first. 3 minutes.
More guides

How-To Guide
How to connect Instagram to Claude: two safe ways to set up comment-to-DM, a DM assistant and scheduled posting (step by step)
15 steps · 11 min
How-To Guide
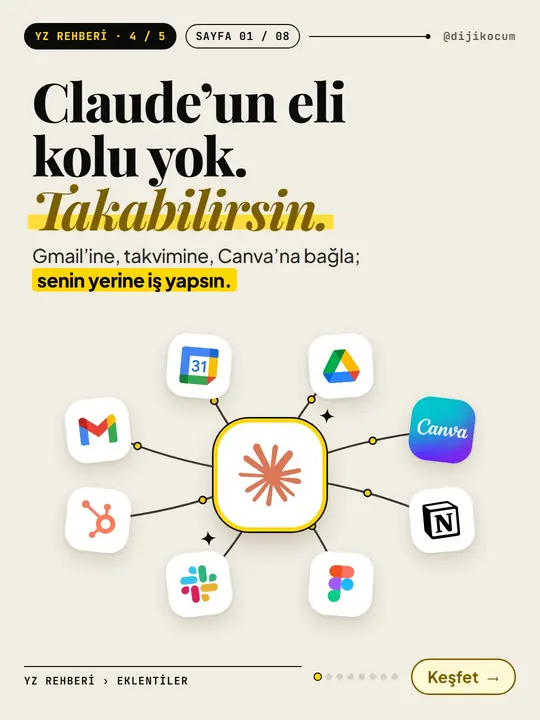
How to Connect Claude to Gmail, Google Calendar, Drive and Canva: Safe Connector Setup, Step by Step
12 steps · 7 min

How-To Guide
Make your restaurant's Instagram look like a menu: a 6-post feed template and shot list
9 steps · 6 min